There are several cases when a java machine would cause high cpu usage on the server.
I will present 2 of the cases we got asked to fix:
High Cpu due to Mysql
There might be a mysql query from the application to the database that will loop, due to coding issues.
You can trace such with below tcpdump command:
tcpdump -nn -A -s 0 'tcp port 3306 and (((ip[2:2] - ((ip[0]&0xf)<<2)) - ((tcp[12]&0xf0)>>2)) != 0)' -c 100000 -i eth0
(replace eth0 with your network interface id)
Also the command may need a bit of tweak, depending on the server you are running it on.
The output will show the mysql transaction/query and you can check if there are any loop query/statements running on.
High Cpu due to a failed connection (Vpn tunnel or something else)
If your application is using vpn tunnels to communicate with api, the application may get high cpu usage if such a vpn tunnel is down. The application will retry the connection over and over again, in loop. This is also bad programming and it needs to be addressed by the developers.
High Cpu due to a bug in the application
There might be a bug/problem within the application code, that will loop over and over in a certain portion of code, causing a high cpu load.
This is harder to troubleshoot and it requires the following tool installed on the server: jvisualvm
Java VisualVM is a tool that provides a visual interface for viewing detailed information about Java technology-based applications (Java applications) while they are running on a Java Virtual Machine (JVM). Java VisualVM organizes JVM data that is retrieved by the Java Development Kit (JDK) tools and presents the information in a way that enables you to quickly view data on multiple Java applications. You can view data on local applications and applications that are running on remote hosts. You can also capture data about the JVM software and save the data to your local system, and view the data later or share the data with others.
Java VisualVM is bundled with JDK version 6 update 7 or greater. You can find its binary in the bin folder of your java installation.
Once you have installed an appropriate JDK version, navigate to your JDK software’s bin directory and double-click the Java VisualVM executable. On Windows this directory will be the following:
Java VisualVM Userdir
On Windows, the default location for the Java VisualVM userdir is the following:
C:\Documents and Settings\<USER>\Application Data\.visualvm\JDK_update-number
To find the location of your Java VisualVM userdir, choose Help > About from the main menu and click Details in the About Java VisualVM window.
Java VisualVM Windows
When you start Java VisualVM, the main Java VisualVM window opens. The main Java VisualVM window is divided into two windows.
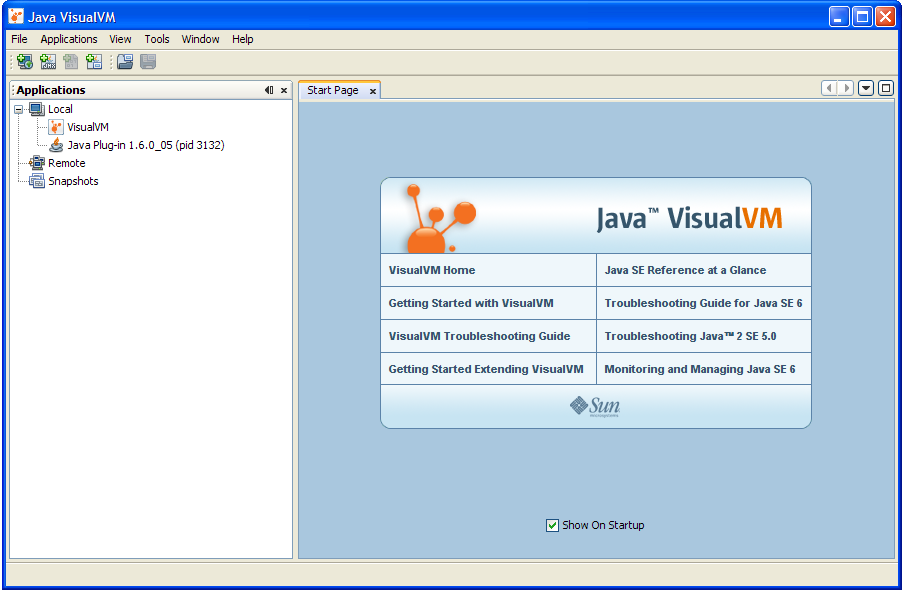
When you first start Java VisualVM, the Applications window is visible in the left side of the window and the Start Page is visible in the right side in the main window. The Start Page contains links to Java VisualVM documentation web pages and additional resources.
Note: The Start Page opens by default each time you start Java VisualVM. You can open the Start Page at any time by choosing Help > Start Page from the main menu. You can also hide the Start page by unchecking the “Show On Startup” check-box.
Applications Window
The Applications window opens in the left side of the main Java VisualVM window when you launch the application. The Applications window is the main point of entry for exploring the details of running applications. The Applications window uses a tree structure to enable you to quickly view the applications running on the local machine and any connected remote machines. You can also access core dumps (Solaris/Linux) and saved snapshots from the Applications window.
Right-clicking a node in the Applications window opens a popup menu that enables you to perform actions related to that node, including opening application tabs, taking heap and thread dumps and opening snapshots in the main window.
For more details about how to use the Applications window to view and save data, see the following pages:
- Using the Applications Window
- Working with Local Applications
- Working with Remote Applications
- Working with VM Coredumps
- Working with Snapshots
Main Window
Detailed information about applications is displayed in the main window. When you view data about an application, each application is represented by a tab in the main window that enables you to easily view and navigate the data. Saved thread dumps and heap dumps are also opened in the main window.
For information about the application data that can be displayed in the main window, see the following pages:
- Application Overview Tab
- Monitoring an Application in the Monitor Tab
- Monitoring Threads in the Threads Tab
- Browsing a Heap Dump
- Profiling an Application in the Profiler Tab (local applications only)
Java VisualVM Heap Dump Creation
In order to troubleshoot memory related issue with Java or Tomcat, it is sometime necessary to create Heap Dumps. These files will then provide deeper analysis of processes and threads that are consuming memory for specific classes that are being executed in the application code. Below are the instructions on how to create or collect a heap dump.
- Connect to the Ephesoft JMX port on your local server (remote connections require port 8900 to be Allowed on the firewall)
- In the jvisualvm UI, right click on the JMX connection you are monitoring.
- Select Heap Dump
- Right Click on the Heap Dump that we created
- Select Save As
Save the Heap Dump file (.hprof extension) to a folder location

Java VisualVM Plugins
You can add functionality to Java VisualVM by using the Plugins manager to install plugins from the Java VisualVM Plugins Center. You can also extend the functionality of Java VisualVM by developing your own plugins that can then be added to an update center.
For example, installing the Java VisualVM-MBeans plugin adds an MBeans tab to the application tab that enables you to monitor and manage MBeans from within Java VisualVM.
To install a Java VisualVM plugin:
- Choose Tools > Plugins from the main menu.
- In the Available Plugins tab, select the Install checkbox for the plugin. Click Install.
Step through and complete the plugin installer.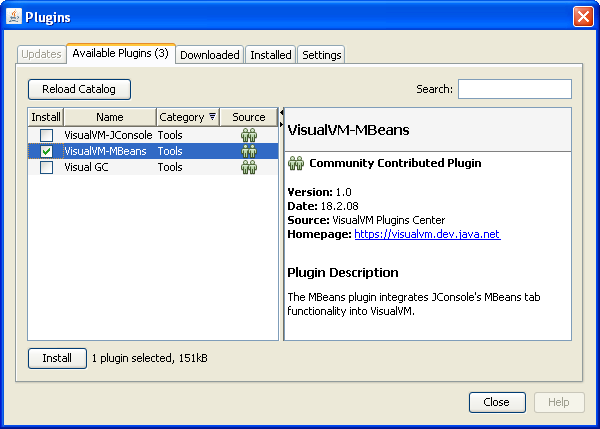
To get to the cpu usage menu, click on the sampler menu, and then select cpu:
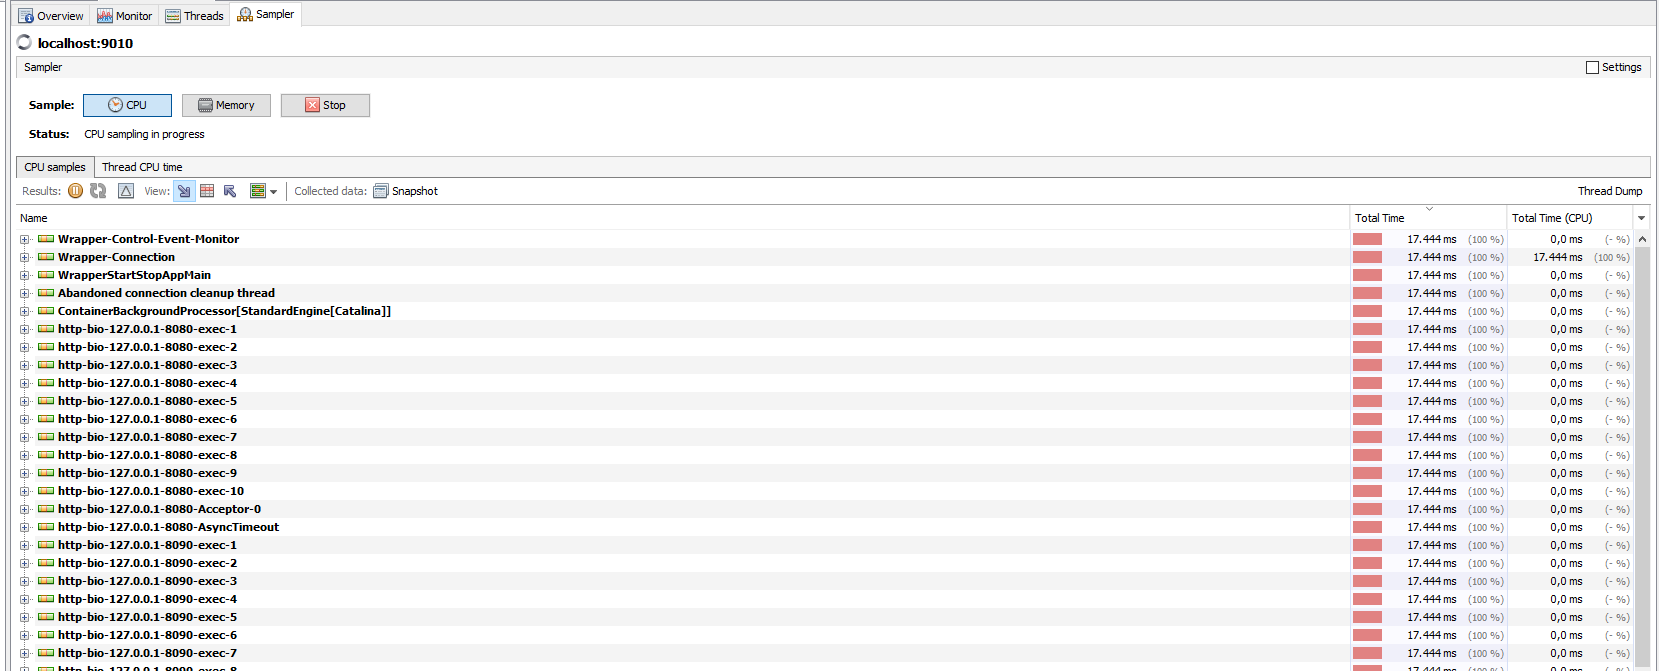
Also below you can see how a high cpu usage would look like in a real case scenario: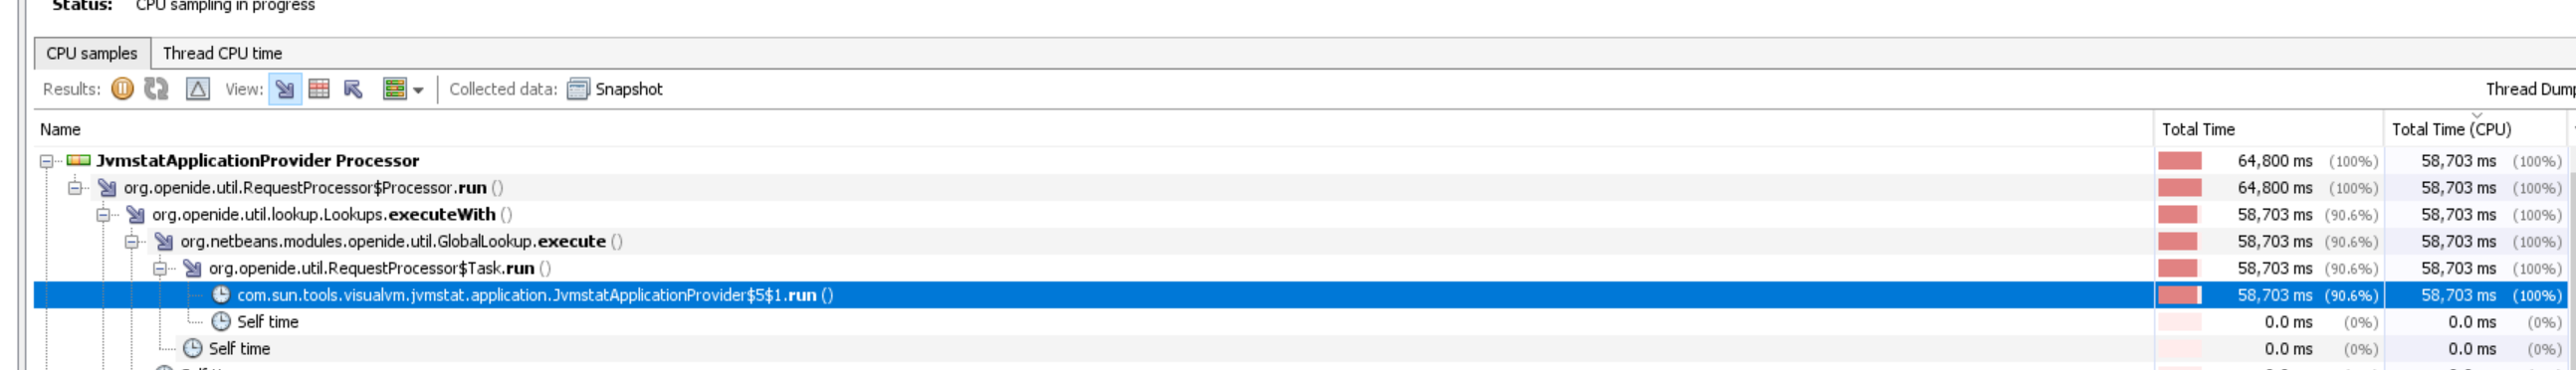
You would see on the "Total time" column the execution time is with Red and also the CPU usage is close to 100%
If you receive this error VisualVM “not supported for this JVM” on all local applications there are different fixes for that:
1. VisualVM needs to be run with the same JVM - at least Java 6 with the same 32-bit/64-bit size - as the program to be profiled.
2. You also need to be the same user
3. It is possible that you need to start the visualvm and then restart the java application while visualvm is running
4. Make sure that your /etc/hosts correctly references the effective ip address of your "hostname". It appears that a discrepancy here totally confuses the poor jvisualvm and its programmers. That being said, make sure to connect to the ip that your java is bind to. Doing other wise may fail.
5. Make sure visualvm is pointing to the correct java in visualvm.conf file visualvm_13\etc\visualvm.conf and specify the path of jvm
6. Others have reported that they have changed the name of their Windows User and set it all lowercase, restarted the PC and it all works afterwards.
by links
http://docs.oracle.com/javase/7/docs/technotes/tools/share/jstatd.html#SECURITY https://stackoverflow.com/a/42107355/3876619
follow these steps to solve the issue
1) Create a permission file
vim /tmp/tools.policy
Add
grant codebase "file:${java.home}/../lib/tools.jar" {
   permission java.security.AllPermission;
};
save it
2) Now add /tmp/tools.policy to JVM startup parameters
-Djava.security.policy=/tmp/tools.policy
3) Run jvisualVm with sudo
HOW TO MONITOR A REMOTE JVM OVER SSH WITH JVISUALVM
Add below to tomcat conf:
SSH Tunnel
ssh -i yourPermissionFile.pem -l username 101.101.101.101 -L 9010:localhost:9010 -L 9011:localhost:9011- Open VisualVM application
- On the left pannel click right on local then add new jmx connection.
- For the connection config put localhost:9010, then click OK.
- Now you are all set, just open the connection and start monitoring your application.